spiva
SPIVA: Measuring Active Fund Performance Against Benchmarks


Using data compiled by S&P Dow Jones Indices, the SPIVA (S&P Indices Versus Active) report highlights an often-overlooked reality: the vast majority of actively managed mutual funds consistently underperform their benchmarks, such as the S&P 500, over long time horizons.
Focusing on the U.S. market, the SPIVA data underscores that most active funds fail to surpass the S&P 500 after accounting for fees and costs. Over 5, 10, and 15 years, the percentage of underperforming funds remains strikingly high, revealing the challenge of achieving superior returns through active management.
What This Means for Investors
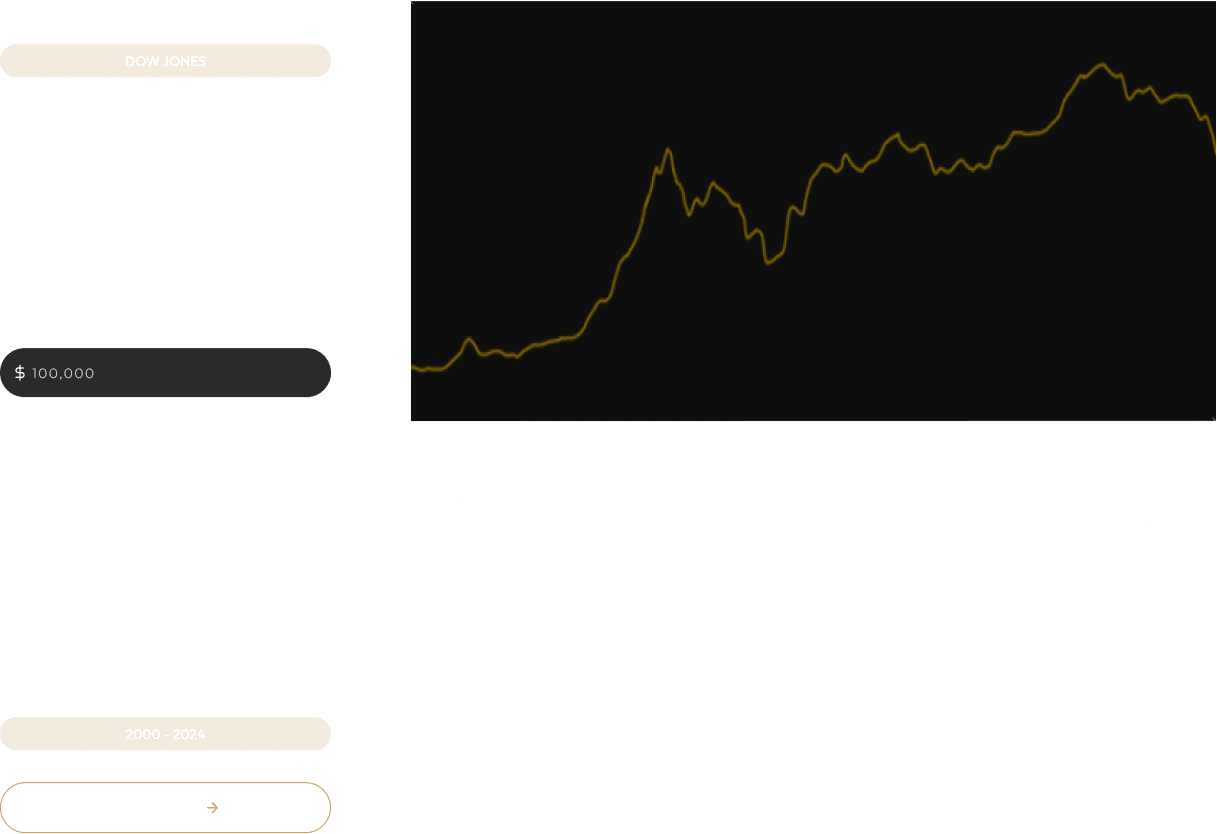
If most active funds can’t match the S&P 500’s performance, where does that leave investors seeking stability or protection against inflation? This is where gold stands out. As demonstrated in our Gold vs. S&P 500 calculator, gold has not only kept pace with the index but has also outperformed it during critical periods, including since the U.S. last balanced its budget in 2000.
What the SPIVA Chart Shows
Our chart highlights the percentage of U.S. actively managed funds that have underperformed the S&P 500 over various timeframes. This data provides a clear reminder of the hurdles active managers face, reinforcing the case for diversification with alternative assets like gold and silver.